Site Shift Study
The Moran Company was asked by The US Oncology Network, Community Oncology Alliance, and ION Solutions to conduct a series of analyses regarding the hypothesis that there has been a shift in the site of service for chemotherapy services in Medicare from the physician office to the Hospital Outpatient Department (HOPD). This memo provides detailed information on the distribution of chemotherapy utilization and Medicare fee-for-service (FFS) payments in these settings.1
Highlights of Our Analyses:
Key Findings to Date
- The analyses conducted so far support the hypothesis that some utilization of chemotherapy services in FFS Medicare has shifted from the physician office to the HOPD over the 2005 to 2011 period.
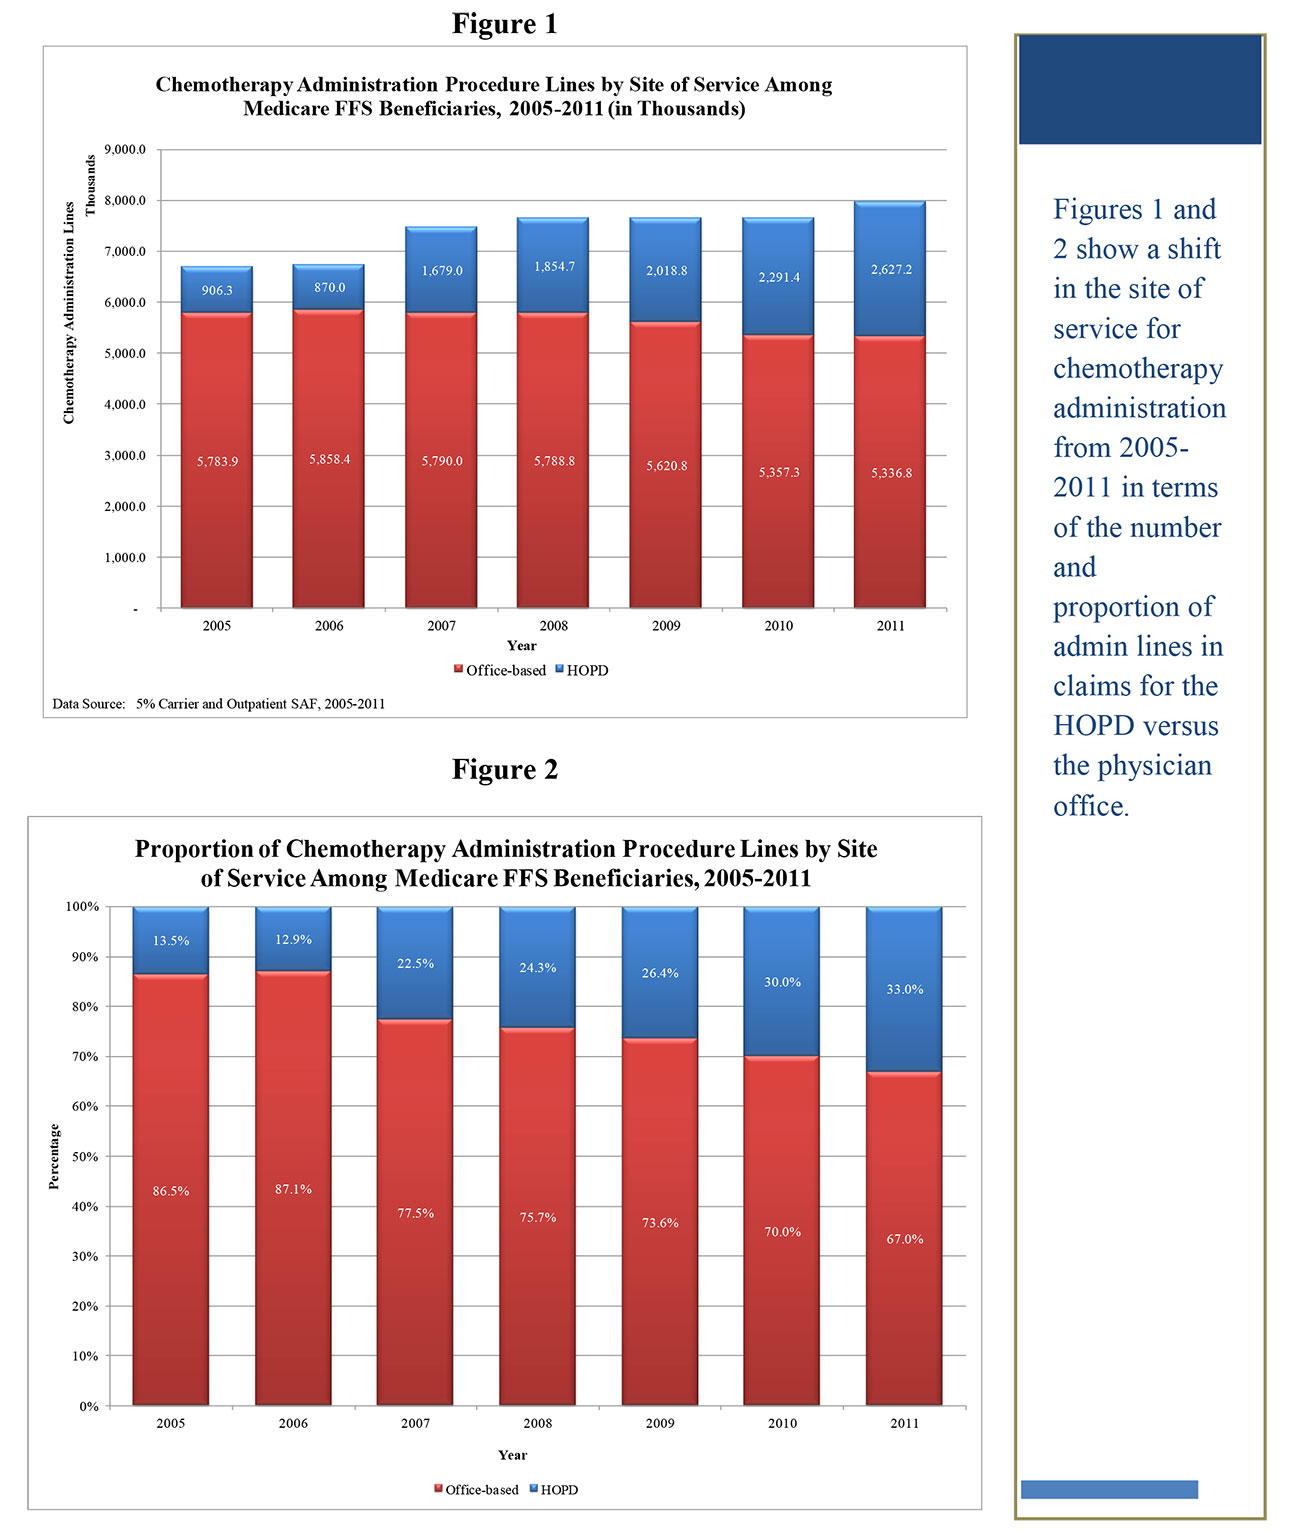
- The total number of FFS chemotherapy administration procedure lines increased in the HOPD and decreased in the physician office between 2005 and 2011 (Figure 1).
- Relative to the physician office, the share of FFS chemotherapy administration procedure lines2 in the HOPD increased considerably over time, from 13.5% in 2005 to 33.0% in 2011 (Figure 2).
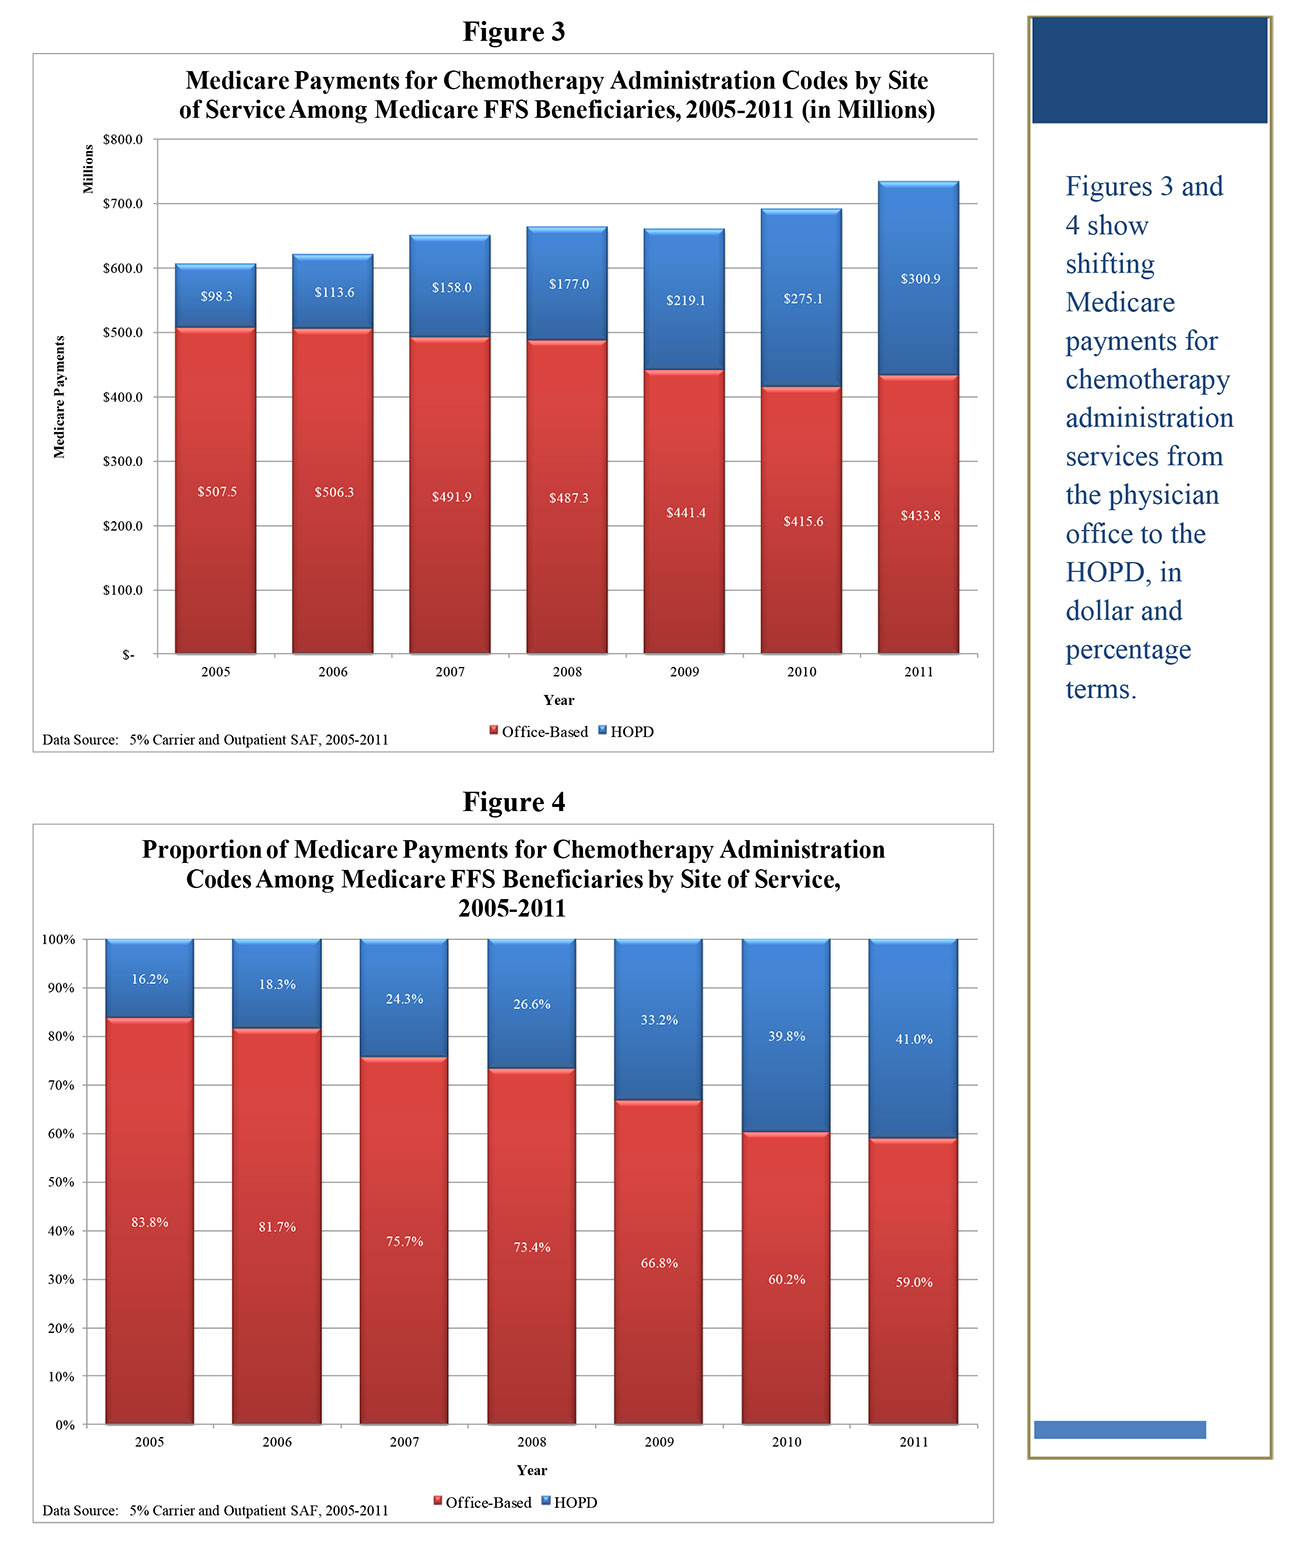
- Overall Medicare payments for chemotherapy administrations among Medicare FFS beneficiaries have grown over time across the two settings from a combined total of $605.8 million in 2005 to a little over $734.7 million in 2011 (Figure 3).
- From 2005 to 2011, Medicare FFS HOPD payments for chemotherapy administration tripled from $98.3 million to $300.9 million, while Medicare FFS payments for physician office chemotherapy administrations decreased by 14.5% from $507.5 million to $433.8 million (Figure 3).
- Relative to physician office Medicare FFS payments for chemotherapy administration, the share of Medicare FFS payments for HOPD chemotherapy administration increased significantly over time from 16.2% in 2005 to 41.0% in 2011 (Figure 4).
- However, please note that the shift of chemotherapy administration payments to HOPD is more prominent than the shift in volume of procedures due to variance in the payment rates between the two settings. HOPD FFS payment rates for these services are higher than physician office FFS payment rates and were increasing throughout the period as physician office payment rates were relatively flat.
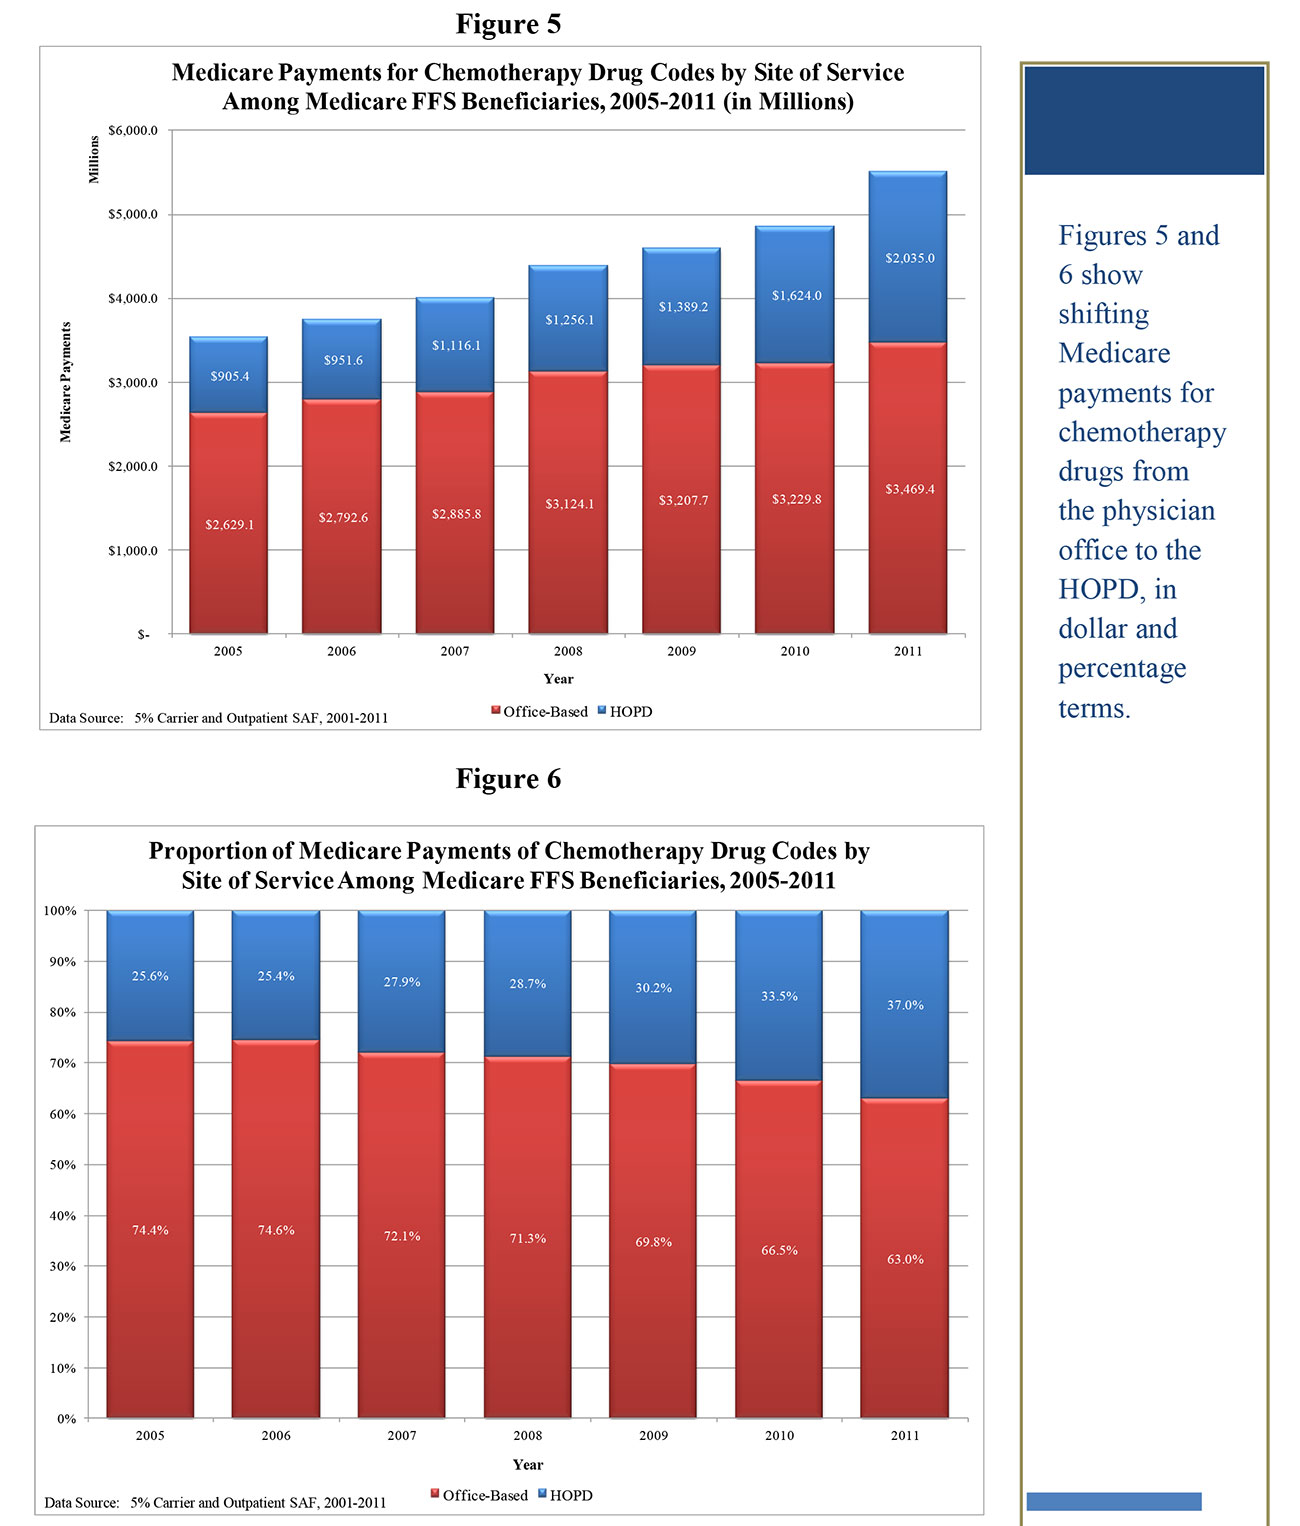
- Medicare FFS payments for chemotherapy drugs for Medicare FFS beneficiaries in the HOPD and the physician office have also increased over time (Figure 5). Payments in the HOPD for chemotherapy drugs in 2011 are more than double those in 2005 ($905.4 million to $2.03 billion), whereas the increase in physician office payments was 32% over the period ($2.63 billion to $3.47 billion).
- Relative to physician office Medicare FFS payments for chemotherapy drugs, the HOPD share of Medicare FFS chemotherapy drug payments increased over time from 25.6% to 37% (Figure 6).
- Despite the significant increase in the HOPD share of chemotherapy administration lines and administration/drug payments, the physician office still remains the dominant site of service for receiving chemotherapy for Medicare FFS beneficiaries.
Methodology:
We used 5% Outpatient and Carrier Medicare Standard Analytic Files (SAFs) from 2005 through 2011 to identify claims for Medicare FFS chemotherapy administration procedures and chemotherapy drugs in HOPD and the physician office settings. HCPCS/CPT® 3 procedure codes were used to identify chemotherapy services. One “chemotherapy administration line” is equivalent to one unique occurrence of the administration code in claims. We also examined Medicare FFS payments for chemotherapy administrations and drugs. Since physicians can bill separately for chemotherapy administrations in the HOPD, payments for chemotherapy administrations in the HOPD were calculated as a sum of payments in the 5% Outpatient SAF and payments in the 5% Carrier SAF with “Outpatient” place of service. All lines counts as well as all payments obtained from the 5% files were multiplied by 20 to get National-level estimates.
Caveats
- We would caution you to interpret the findings with care, as some apparent shifts in utilization are likely mitigated by other factors. For instance, over the period in question, physician reimbursement rates for services, including drug administration, have been relatively flat—while HOPD reimbursement has had moderate increases. Similarly, HOPD reimbursement for Part B drugs has varied over the period in question in the range of ASP+4% to ASP+6% while physician reimbursement was ASP+6% over the period.4
- Analysis of the distribution of chemotherapy administration and drug5 lines between the HOPD and physician office does not contradict the general proposition that chemotherapy volume is shifting to the HOPD. While the shift is less dramatic than suggested by the corresponding shift in chemotherapy administration and drug payments, the shift is still material.
- We are continuing to investigate the role of reimbursement changes and other factors in the analyses we have presented here and will issue refinements to these analyses as we do so. As a result, we may clarify some of our findings.
- In discussing these matters with policymakers, it will be important to keep in mind the strengths and weaknesses of various metrics to measure any shift from the office to the HOPD.
Overview of the Figures that Follow:
- Chemotherapy Administration Procedures Trends: 2005-2011
- Chemotherapy Administration Procedures Medicare Payments: 2005-2011
- Chemotherapy Drug Medicare Payments: 2005-2011
- In this memo, “Medicare payments” are payments made by the Medicare FFS program for chemotherapy services. It does not include beneficiary cost sharing.
- One “chemotherapy administration line” is equivalent to one unique occurrence of the administration in claims.
- CPT copyright 2009-2011 American Medical Association. All rights reserved. CPT is a registered trademark of the American Medical Association.
- Note that in the HOPD setting there have been yearly increases in the market basket update, while the updates to physician services (the conversion factor) has remained at almost a constant level or unchanged such as between the years of 2005-2007.
- The share of chemotherapy drug lines billed in HOPD (versus office) increased from 17.2% in 2001 to 24.6% in 2011.
Site Shift Study

The Moran Company was asked by The US Oncology Network, Community Oncology Alliance, and ION Solutions to conduct a series of analyses regarding the hypothesis that there has been a shift in the site of service for chemotherapy services in Medicare from the physician office to the Hospital Outpatient Department (HOPD). This memo provides detailed information on the distribution of chemotherapy utilization and Medicare fee-for-service (FFS) payments in these settings.1
Highlights of Our Analyses:
Key Findings to Date
- The analyses conducted so far support the hypothesis that some utilization of chemotherapy services in FFS Medicare has shifted from the physician office to the HOPD over the 2005 to 2011 period.
- The total number of FFS chemotherapy administration procedure lines increased in the HOPD and decreased in the physician office between 2005 and 2011 (Figure 1).
- Relative to the physician office, the share of FFS chemotherapy administration procedure lines2 in the HOPD increased considerably over time, from 13.5% in 2005 to 33.0% in 2011 (Figure 2).
- Overall Medicare payments for chemotherapy administrations among Medicare FFS beneficiaries have grown over time across the two settings from a combined total of $605.8 million in 2005 to a little over $734.7 million in 2011 (Figure 3).
- From 2005 to 2011, Medicare FFS HOPD payments for chemotherapy administration tripled from $98.3 million to $300.9 million, while Medicare FFS payments for physician office chemotherapy administrations decreased by 14.5% from $507.5 million to $433.8 million (Figure 3).
- Relative to physician office Medicare FFS payments for chemotherapy administration, the share of Medicare FFS payments for HOPD chemotherapy administration increased significantly over time from 16.2% in 2005 to 41.0% in 2011 (Figure 4).
- However, please note that the shift of chemotherapy administration payments to HOPD is more prominent than the shift in volume of procedures due to variance in the payment rates between the two settings. HOPD FFS payment rates for these services are higher than physician office FFS payment rates and were increasing throughout the period as physician office payment rates were relatively flat.
- Medicare FFS payments for chemotherapy drugs for Medicare FFS beneficiaries in the HOPD and the physician office have also increased over time (Figure 5). Payments in the HOPD for chemotherapy drugs in 2011 are more than double those in 2005 ($905.4 million to $2.03 billion), whereas the increase in physician office payments was 32% over the period ($2.63 billion to $3.47 billion).
- Relative to physician office Medicare FFS payments for chemotherapy drugs, the HOPD share of Medicare FFS chemotherapy drug payments increased over time from 25.6% to 37% (Figure 6).
- Despite the significant increase in the HOPD share of chemotherapy administration lines and administration/drug payments, the physician office still remains the dominant site of service for receiving chemotherapy for Medicare FFS beneficiaries.
Methodology:
We used 5% Outpatient and Carrier Medicare Standard Analytic Files (SAFs) from 2005 through 2011 to identify claims for Medicare FFS chemotherapy administration procedures and chemotherapy drugs in HOPD and the physician office settings. HCPCS/CPT® 3 procedure codes were used to identify chemotherapy services. One “chemotherapy administration line” is equivalent to one unique occurrence of the administration code in claims. We also examined Medicare FFS payments for chemotherapy administrations and drugs. Since physicians can bill separately for chemotherapy administrations in the HOPD, payments for chemotherapy administrations in the HOPD were calculated as a sum of payments in the 5% Outpatient SAF and payments in the 5% Carrier SAF with “Outpatient” place of service. All lines counts as well as all payments obtained from the 5% files were multiplied by 20 to get National-level estimates.
Caveats
- We would caution you to interpret the findings with care, as some apparent shifts in utilization are likely mitigated by other factors. For instance, over the period in question, physician reimbursement rates for services, including drug administration, have been relatively flat—while HOPD reimbursement has had moderate increases. Similarly, HOPD reimbursement for Part B drugs has varied over the period in question in the range of ASP+4% to ASP+6% while physician reimbursement was ASP+6% over the period.4
- Analysis of the distribution of chemotherapy administration and drug5 lines between the HOPD and physician office does not contradict the general proposition that chemotherapy volume is shifting to the HOPD. While the shift is less dramatic than suggested by the corresponding shift in chemotherapy administration and drug payments, the shift is still material.
- We are continuing to investigate the role of reimbursement changes and other factors in the analyses we have presented here and will issue refinements to these analyses as we do so. As a result, we may clarify some of our findings.
- In discussing these matters with policymakers, it will be important to keep in mind the strengths and weaknesses of various metrics to measure any shift from the office to the HOPD.
Overview of the Figures that Follow:
- Chemotherapy Administration Procedures Trends: 2005-2011
- Chemotherapy Administration Procedures Medicare Payments: 2005-2011
- Chemotherapy Drug Medicare Payments: 2005-2011


- In this memo, “Medicare payments” are payments made by the Medicare FFS program for chemotherapy services. It does not include beneficiary cost sharing.
- One “chemotherapy administration line” is equivalent to one unique occurrence of the administration in claims.
- CPT copyright 2009-2011 American Medical Association. All rights reserved. CPT is a registered trademark of the American Medical Association.
- Note that in the HOPD setting there have been yearly increases in the market basket update, while the updates to physician services (the conversion factor) has remained at almost a constant level or unchanged such as between the years of 2005-2007.
- The share of chemotherapy drug lines billed in HOPD (versus office) increased from 17.2% in 2001 to 24.6% in 2011.
